Like many physical processes, photoemission works in reverse. Electrons of a known energy, focused on a sample, can “fall” into the sample if the energy is just right. In order to do so, they need to lose some energy so they emit photons. If one varies the incident electron energy and detects the emission of photons, more will be detected when the energy is just right. It is possible to get information about unoccupied electron energy states of a sample by observing what the “just right” energy is. We call this Inverse Photoemission Spectroscopy (IPES), and it helps surface scientists explore surface states in order to refine our theoretical understanding and even design new materials.
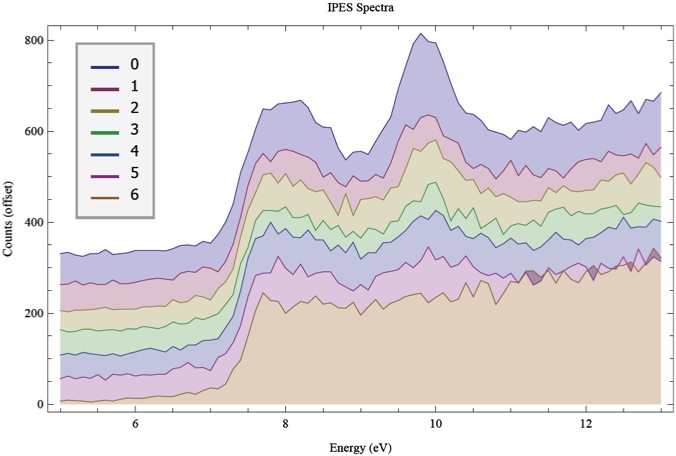
Below is some IPES data I took after bombarding a clean nickel sample. On the y-axis is the intensity of the observed signal – how many photons are counted. The x-axis describes the energy of the electrons being shot at the sample. The trace index describes the number of five-minute sputters performed on the sample. Zero corresponds to clean, 1 is five minutes, 2 is ten minutes, etc. The traces are offset to exhibit the progression. The first peak (~7.5 eV) indicates the Fermi Level and the second one (~10 eV) indicates a surface electronic state. For more bombardment, the surface is disordered and cannot support the surface state. This is shown below where the 10 eV peak decreases in intensity for longer sputter times.