Putting it all together
All my work attempting to figure out just what is happening to the surface of a crystalline sample when I sputter it is fascinating, but it can be somewhat esoteric to folks without my specific interests. In order to tie it all together into a self-consistent story which advances the state of knowledge for a larger number of scientists, I’m using the results of IPES, LEED, and workfunction measurements to inform a model to predict the effects of sputtering, which for all its practical application is not totally understood. I use Monte Carlo Simulation methods in order to simulate sputtering damage and analyze the state of the surface after various sputtering doses.
Some Results of the Monte Carlo Simulation
Below is a progression of the simulated crystal surface after 5 min. increments of sputtering. What’s shown in each panel is a 50 atom by 50 atom square of a much larger simulated crystal. As represented, the clean surface at 0 min. would be all white, undamaged area. As the simulation damages the surface, removing an atom or more during each collision, the square representing that atomic site turns grey. Darker squares have more than one atom missing from that site.

Curves showing the relative presence of atoms in specifically sized undamaged areas can be constructed from the Monte Carlo simulated crystal and a few are shown below. On the y-axis is intensity, essentially the percentage of undamaged sites contained in the undamaged area represented by each curve. Sputtering dose is on the x-axis. Each curve then represents the fraction of undamaged sites contained in patches of 2.22, 4.44, etc. unit cells.
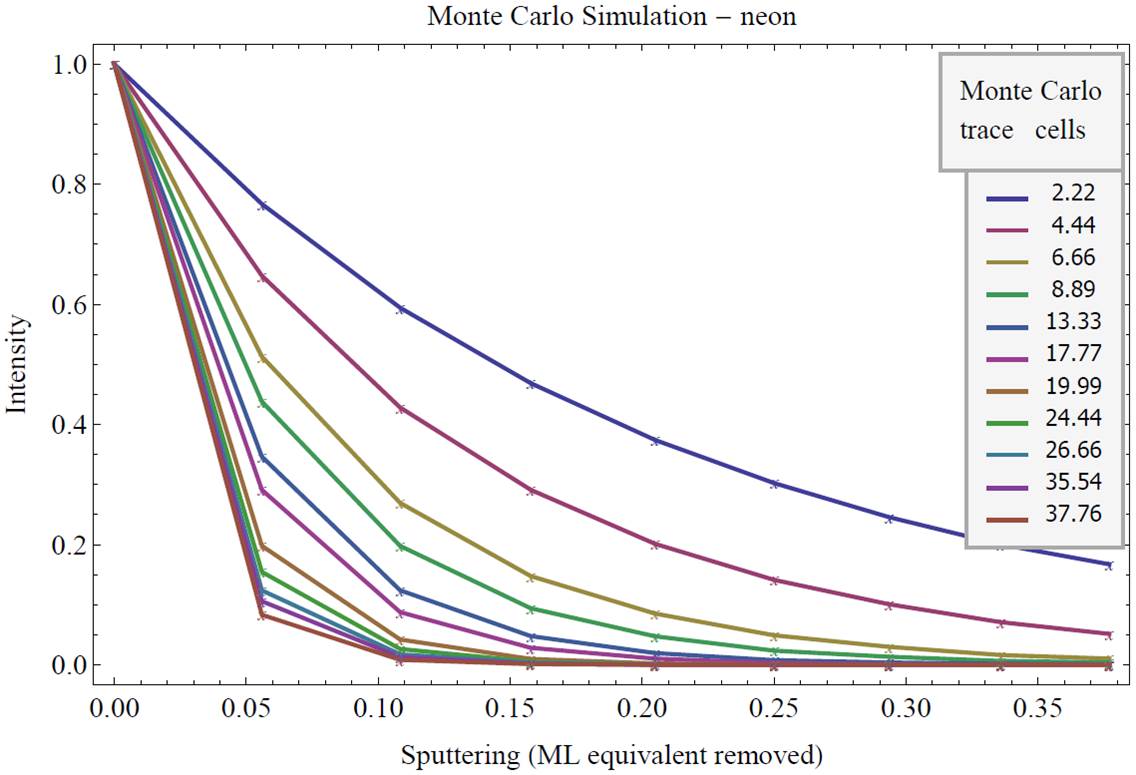
These Monte Carlo curves may then be compared to the results of LEED, IPES, and work function measurements. Agreement between the shapes of these curves suggest what sized area of untouched surface is necessary to sustain certain features. This has already shown, for instance, that the surface state intensity reduction in IPES measurements appears strongly tied to undamaged areas of about 50 unit cells. Incorporating results from different sputtering parameters makes the model more robust and I look forward to continuing this work in the future, extending it to describe more types of systems and properties.